Customizing the symbol plot | ||
| ||
From the main menu bar, select OptionsCommon.
The Common Plot Options dialog box appears.
In the Common Plot Options dialog box, click the Basic tab if it is not already selected. Choose Wireframe for the render style and Feature edges for the visible edges.
From the main menu bar, select OptionsSymbol.
The Symbol Plot Options dialog box appears.
In the Color & Style tabbed page, do the following:
- Click the Vector tab.
- Set the color type to Uniform.
- Click the color sample
 .
.Abaqus/CAE displays the Select Color dialog box.
- Click the RGB tab and set the red, green, and blue values to 0, 255 and 255, respectively.
Tip: You can also select cyan from the colors near the bottom of the dialog box or use any of the other available selection methods. - Click OK to accept your selection and to close the Select Color dialog box.
- Drag the Size slider to select 12 as the maximum length of the vector.
Click OK to apply your changes and to close the Symbol Plot Options dialog box.
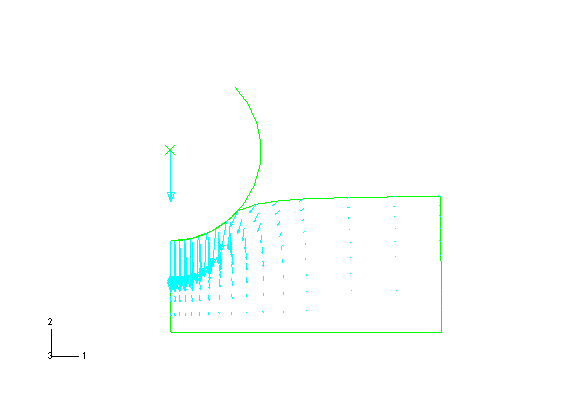
The customized symbol plot appears, as shown in Figure 1.
Figure 1. Customized symbol plot.