From the main menu bar, select . Abaqus displays the Field Output dialog box. You use the Field Output dialog box to select the variable to display.
Click the Primary Variable tab if it is not already selected. To select the 22-component of strain as the primary variable, do the following:
- From the Output Variable field, select LE (logarithmic strain components at integration points).
- From the Component field, select the component LE22.
Click OK to select LE22 as the primary variable and to close the Field Output dialog box.
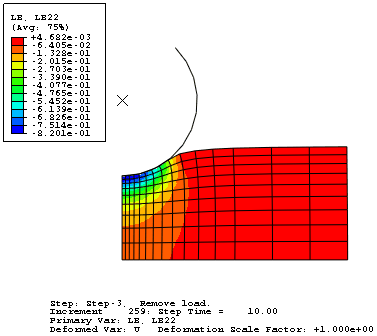
The contour plot in the current viewport changes to a plot of LE22, as shown in Figure 1.
Figure 1. Contour plot of the model after the last increment of the third step.

|
 on the left side of the Field Output toolbar to make your selections from the Field Output dialog box instead of the toolbar. If you use the dialog box, you must click Apply or OK for Abaqus/CAE Abaqus/Viewer to display your selections in the viewport.