Contour plots | ||
| ||
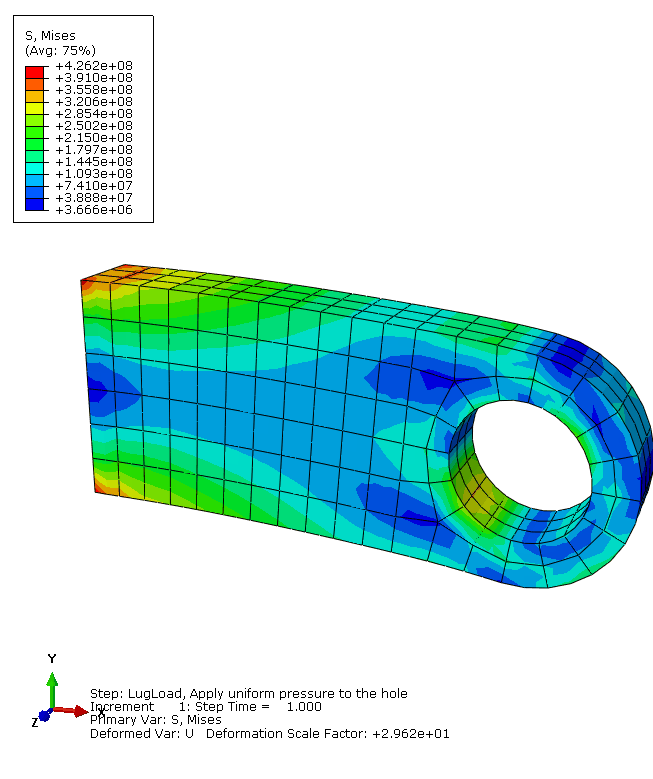
Generate a contour plot of the Mises stress
![]()
Generate a customized contour plot
Context:
Abaqus/CAE
offers many options to customize contour plots. To see the available options,
click the
 tool in the toolbox. By default,
Abaqus/CAE
automatically computes the minimum and maximum values shown in your contour
plots and evenly divides the range between these values into 12 intervals. You
can control the minimum and maximum values
Abaqus/CAE
displays (for example, to examine variations within a fixed set of bounds), as
well as the number of intervals.
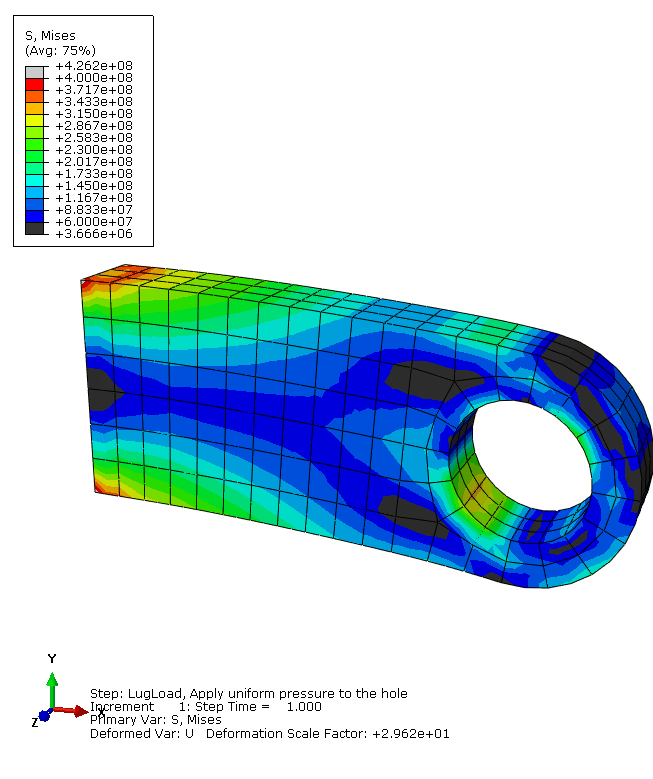
Figure 2. Customized plot of Mises stress.


