The status (.sta) file | ||
| ||
You can browse or search this file by clicking the tab in the Job Monitor. The status file contains information about moments of inertia, followed by information concerning the stability limit. The 10 elements with the lowest stable time limits are listed in rank order.
    Most critical elements:
    Element number   Rank    Time increment   Increment ratio
    (Instance name)
   ----------------------------------------------------------
           1          1       2.237266E-06      1.000000E+00
    BAR-1
          10          2       2.237266E-06      1.000000E+00
    BAR-1
          21          3       2.237266E-06      1.000000E+00
    BAR-1
          30          4       2.237266E-06      1.000000E+00
    BAR-1
          31          5       2.237266E-06      1.000000E+00
    BAR-1
          40          6       2.237266E-06      1.000000E+00
    BAR-1
          51          7       2.237266E-06      1.000000E+00
    BAR-1
          60          8       2.237266E-06      1.000000E+00
    BAR-1
          61          9       2.237266E-06      1.000000E+00
    BAR-1
          70         10       2.237266E-06      1.000000E+00
    BAR-1
The status file continues with information about the progress of
the solution.
   STEP 1  ORIGIN 0.0000

   Total memory used for step 1 is approximately 6.8 megabytes.
   Global time estimation algorithm will be used.
   Scaling factor :  1.0000
   Variable mass scaling factor at zero increment:  1.0000


              STEP     TOTAL       CPU      STABLE    CRITICAL    KINETIC      TOTAL
INCREMENT     TIME      TIME      TIME   INCREMENT     ELEMENT     ENERGY     ENERGY
        0  0.000E+00 0.000E+00  00:00:00 2.237E-06          70  0.000E+00  0.000E+00
INSTANCE WITH CRITICAL ELEMENT: BAR-1
ODB Field Frame Number      0 of      4 requested intervals at increment zero.
        5  1.119E-05 1.119E-05  00:00:00 2.237E-06          70  4.504E-05 -1.963E-06
       10  2.237E-05 2.237E-05  00:00:00 2.237E-06        2010  9.189E-05 -2.218E-06
       15  3.471E-05 3.471E-05  00:00:00 2.931E-06        2090  1.434E-04 -2.361E-06
       19  4.640E-05 4.640E-05  00:00:00 2.910E-06        1040  1.607E-04  1.850E-06
       21  5.221E-05 5.221E-05  00:00:00 2.902E-06         600  1.588E-04  2.585E-06
ODB Field Frame Number      1 of      4 requested intervals at  5.176230E-05
       25  6.380E-05 6.380E-05  00:00:00 2.890E-06         590  1.569E-04  6.082E-07
       29  7.535E-05 7.535E-05  00:00:00 2.880E-06        4640  1.553E-04 -7.049E-07
       33  8.685E-05 8.685E-05  00:00:00 2.873E-06        4670  1.537E-04 -1.386E-06
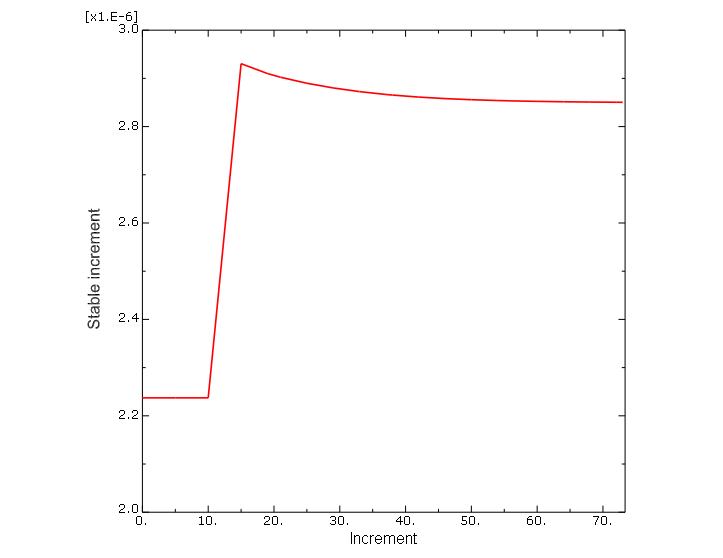
Similar information is available in the Job Diagnostics dialog box of the Visualization module. This dialog box also allows you to plot histories of the data, as shown in Figure 1. To create a history plot, select a step from the Job History, select a column in the Incrementation tab, and click .
Figure 1. Stable time increment history.

