Forming analysis—attempt 2 | ||
| ||
We will now analyze the forming stage using a smoothly applied holder force and a smoothly applied punch displacement; we will compare the results to those obtained earlier. Refer to Smooth amplitude curves for an explanation of the smooth step amplitude curve.
Define a smooth step amplitude curve named Smooth1. Enter the amplitude data given in Table 1. Create a second smooth step amplitude curve named Smooth2 using the amplitude data given in Table 2. Modify the RefHolderForce load in the Holder force step so that it refers to the Smooth1 amplitude. Modify the displacement boundary condition RefPunchBC in the Move punch step so that it refers to the Smooth2 amplitude. By specifying an amplitude of 0.0 at the beginning of the step and an amplitude of 1.0 at the end of the step, Abaqus/Explicit creates an amplitude definition that is smooth in both its first and second derivatives. Therefore, using a smooth step amplitude curve for the displacement control also assures us that the velocity and acceleration are smooth.
Create a job named Forming-2. Give the job the following description: Channel forming -- attempt 2.
Save your model, and submit the job for analysis. Monitor the solution progress; correct any modeling errors that are detected, and investigate the cause of any warning messages.
- Evaluating the results for attempt 2
-
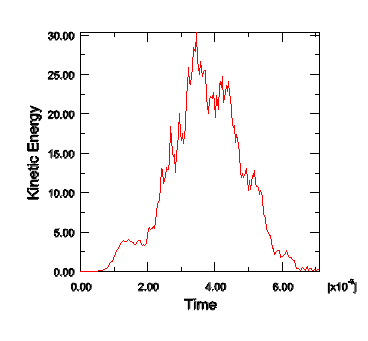
The kinetic energy history is shown in Figure 1. The response of the kinetic energy is clearly related to the forming of the blank: the value of kinetic energy peaks in the middle of the second step, corresponding to the time when the punch velocity is the greatest. Thus, the kinetic energy is appropriate and reasonable.
Figure 1. Kinetic energy history for forming analysis, attempt 2.
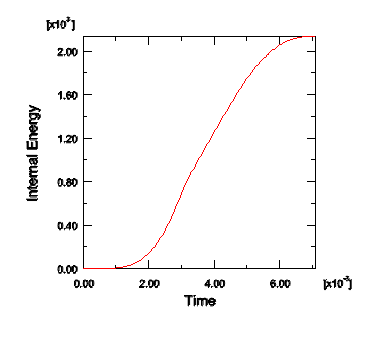
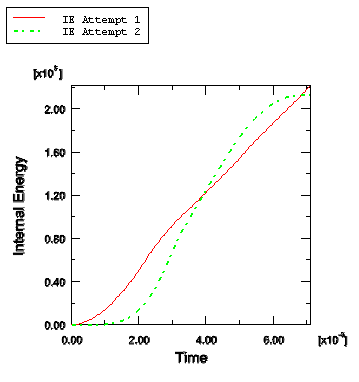
The internal energy for attempt 2, shown in Figure 2, shows a smooth increase from zero up to the final value. Again, the ratio of kinetic energy to internal energy is quite small and appears to be acceptable. Figure 3 compares the internal energy in the two forming attempts.
Figure 2. Internal energy history for forming analysis, attempt 2.
Figure 3. Comparison of internal energies for the two attempts of the forming analysis.