Plotting the eigenmodes of the pipe | ||
| ||
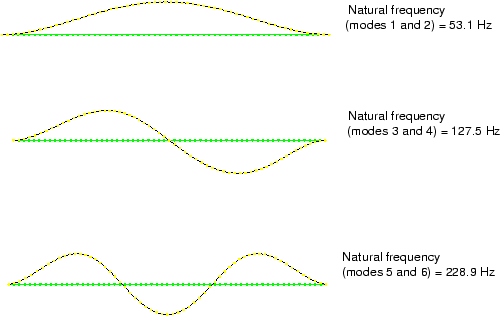
Figure 1. Shapes and frequencies of eigenmodes 1 through 6 with 8 MN tensile
load.


Under 8 MN of axial load, the lowest mode is now at 53.1 Hz, which is greater than the required minimum of 50 Hz. If you want to find the exact load at which the lowest mode is just above 50 Hz, you can repeat this restart analysis and change the value of the applied load.