Evaluating the results | ||
| ||
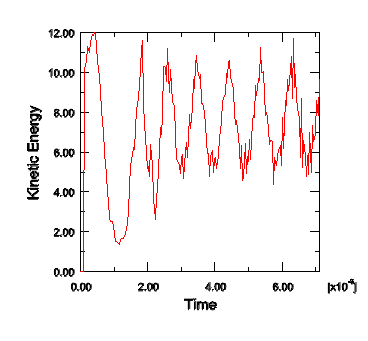
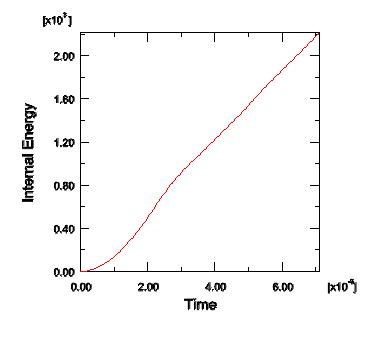
History plots of the kinetic and internal energies for the whole model appear as shown in Figure 1 and Figure 2, respectively.


The kinetic energy history shown in Figure 1 oscillates significantly. In addition, the kinetic energy history has no clear relation to the forming of the blank, which indicates the inadequacy of this analysis. In this analysis the punch velocity remains constant, while the kinetic energy—which is primarily due to the motion of the blank—is far from constant.
Comparing Figure 1 and Figure 2 shows that the kinetic energy is a small fraction (less than 1%) of the internal energy through all but the very beginning of the analysis. The criterion that kinetic energy must be small relative to internal energy has been satisfied, even for this severe loading case.
Although the kinetic energy of the model is a small fraction of the internal energy, it is still quite noisy. Therefore, we should change the simulation in some way to obtain a smoother response.