Postprocessing | ||
| ||
- Plotting the deformed model shape
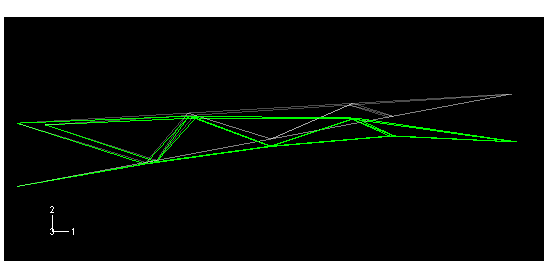
To begin this exercise, plot the deformed model shape with the undeformed model shape superimposed on it. Specify a nondefault view using (0, 0, 1) as the X-, Y-, and Z-coordinates of the viewpoint vector and (0, 1, 0) as the X-, Y-, and Z-coordinates of the up vector.
Tip: You can also display the model using this view by clicking  from the Views toolbar.
 The undeformed shape of the crane superimposed upon the deformed shape is shown in Figure 1.
Figure 1. Deformed shape of cargo crane.
- Using display groups to plot element and node sets
You can use display groups to plot existing node and element sets; you can also create display groups by selecting nodes or elements directly from the viewport. You will create a display group containing only the elements associated with the main members in truss structure A.
To create and plot a display group:
In the Results Tree, expand the Sections container underneath the output database file named Crane.odb.
To facilitate your selection, change the view back to the default isometric view using the
 tool in the Views toolbar.
Tip: If the Views toolbar is not visible, select from the main menu bar. In succession, click the items in the container until the elements associated with the main members in truss A are highlighted in the viewport. Click mouse button 3 on this item and select Replace from the menu that appears.
Abaqus/CAE now displays only this group of elements.
To save this group, double-click Display Groups in the Results Tree; or use the
 tool in the Display Group toolbar.
The Create Display Group dialog box appears.
In the Create Display Group dialog box, click and enter MainA as the name for your display group.
Click Dismiss to close the Create Display Group dialog box.
This display group now appears underneath the Display Groups container in the Results Tree.
- Beam cross-section orientation
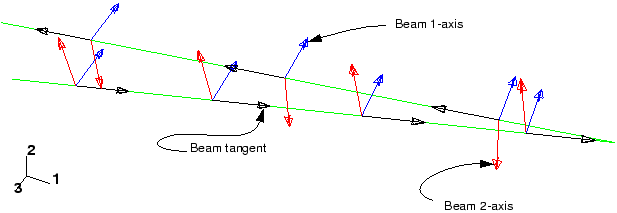
You will now plot the section axes and beam tangents on the undeformed model shape.
To plot the beam section axes:
From the main menu bar, select ; or use the
 tool in the toolbox to display only the undeformed model shape.
From the main menu bar, select ; then, click the Normals tab in the dialog box that appears.
Toggle on Show normals, and accept the default setting of On elements.
In the Style area at the bottom of the Normals page, specify the Length to be Long.
Click .
The section axes and beam tangents are displayed on the undeformed shape.
The resulting plot is shown in Figure 2. The text annotations in Figure 2 that identify the section axes and beam tangent will not appear in your image. The vector showing the local beam 1-axis, , is blue; the vector showing the beam 2-axis, , is red; and the vector showing the beam tangent, , is white.
Figure 2. Plot of beam section axes and tangents for elements in display group MainA.
- Rendering beam profiles
You will now display an idealized representation of the beam profile and contour the stress results.
To render beam profiles:
From the main menu bar, select .
The ODB Display Options dialog box appears.
In the General tabbed page, toggle on Render beam profiles and accept the default scale factor of 1.
Click .
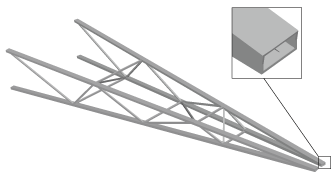
Abaqus/CAE displays beam profiles with the appropriate dimensions and in the correct orientations. Figure 3 shows the beam profiles on the whole model. Your changes are saved for the duration of the session.
Click
 to contour the Mises stress on the rendered profile.
Figure 3. Cargo crane with beam profiles displayed.
- Creating a hard copy
You can save the current image to a file for hard-copy output.
To create a PostScript file of the current image:
From the main menu bar, select .
The Print dialog box appears.
From the Settings area in the Print dialog box, select Black&White as the Rendition type; and toggle on File as the Destination.
Select PS as the Format, and enter beam.ps as the File name.
Click
 .
.The PostScript Options dialog box appears.
From the PostScript Options dialog box, select 600 dpi as the Resolution; and toggle off Print date.
Click to apply your selections and to close the dialog box.
In the Print dialog box, click .
Abaqus/CAE creates a PostScript file of the current image and saves it in your working directory as beam.ps. You can print this file using your system's command for printing PostScript files.
- Displacement summary
Write a summary of the displacements of all nodes in display group MainA to a file named crane.rpt. The peak displacement at the tip of the crane in the 2-direction is 0.0188 m.
- Section forces and moments
Abaqus can provide output for structural elements in terms of forces and moments acting on the cross-section at a given point. These section forces and moments are defined in the local beam coordinate system. Toggle off the rendering of beam profiles, then contour the section moment about the beam 1-axis in the elements in display group MainA. For clarity, reset the view so that the elements are displayed in the 1–2 plane.
To create a “bending moment”-type contour plot:
From the list of variable types on the left side of the Field Output toolbar, select Primary.
From the list of output variables in the center of the toolbar, select .
Abaqus/CAE automatically selects , the first component name in the list on the right side of the Field Output toolbar, and displays a contour plot of the bending moment about the beam 1-axis on the deformed model shape. The deformation scale factor is chosen automatically since geometric nonlinearity was not considered in the analysis.
Open the dialog box, and select a Uniform deformation scale factor of 1.0.
Color contour plots of this type typically are not very useful for one-dimensional elements such as beams. A more useful plot is a “bending moment”-type plot, which you can produce using the contour options.
From the main menu bar, select ; or use the
 tool in the toolbox.
The Contour Plot Options dialog box appears; by default, the Basic tab is selected.
In the field, toggle on Show tick marks for line elements.
Click .
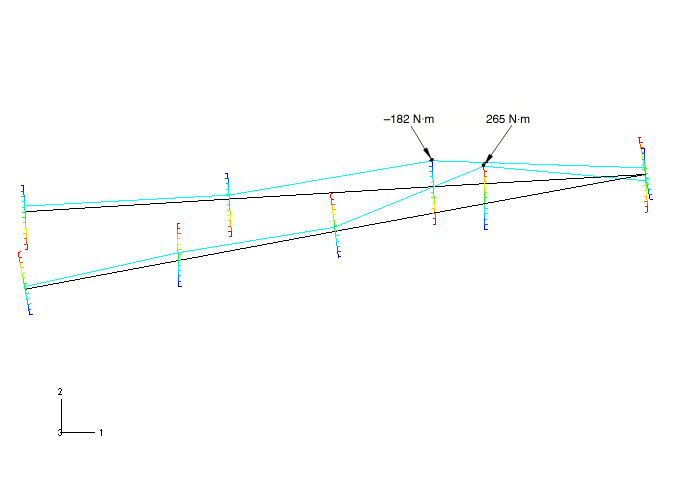
The plot shown in Figure 4 appears. The magnitude of the variable at each node is now indicated by the position at which the contour curve intersects a “tick mark” drawn perpendicular to the element. This “bending moment”-type plot can be used for any variable (not just bending moments) for any one-dimensional element, including trusses and axisymmetric shells as well as beams.
Figure 4. Bending moment diagram (moment about beam 1-axis) for elements in display group MainA. The locations with the highest stress (created by the bending of the elements) are indicated.