Reading history output data | ||
| ||
a node
an integration point
a region
a material point
Note:
History data from an analysis cannot contain multiple points.
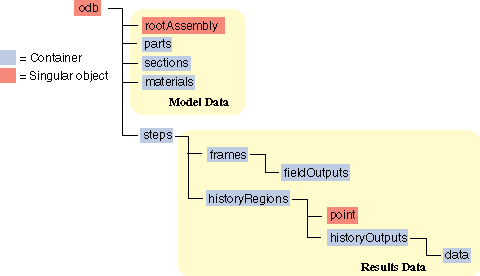
The history data object model is shown in Figure 1.

In contrast to field output, which is associated with a frame, history output is associated with a step. History output data are stored in the historyRegions repository under an OdbStep object. Abaqus creates keys to the historyRegions repository that describe the region; for example,
'Node PART-1-1.1000'
'Element PART-1-1.2 Int Point 1'
'Assembly rootAssembly'
The output from all history requests that relate to a specified point is collected in one HistoryRegion object. A HistoryRegion object contains multiple HistoryOutput objects. Each HistoryOutput object, in turn, contains a sequence of (frameValue, value) sequences. In a time domain analysis (domain=TIME) the sequence is a tuple of (stepTime, value). In a frequency domain analysis (domain=FREQUENCY) the sequence is a tuple of (frequency, value). In a modal domain analysis (domain=MODAL) the sequence is a tuple of (mode, value).
In the analysis that generated the Abaqus/CAE Visualization module tutorial output database, the user asked for the following history output:
- At the rigid body reference point (Node 1000)
-
U
V
A
- At the corner element
-
MISES
LE22
S22
The history output data can be retrieved from the HistoryRegion objects in the output database. The tutorial output database contains HistoryRegion objects that relate to the rigid body reference point and the integration points of the corner element as follows:
'Node PART-1-1.1000'
'Element PART-1-1.1 Int Point 1'
'Element PART-1-1.1 Int Point 2'
'Element PART-1-1.1 Int Point 3'
'Element PART-1-1.1 Int Point 4'
The following statements read the tutorial output database and write the U2 history data from the second step to an ASCII file that can be plotted by Abaqus/CAE:
    odb_Step& step = odb.steps()["Step-2"];
    odb_Instance& instance =
        odb.rootAssembly().instances()["PART-1-1"];
    odb_Set& nSet = instance.nodeSets()["PUNCH"];
    const odb_Node node = nSet.nodes().constGet(0);
    odb_HistoryPoint hPoint(node);
    odb_HistoryRegion& histRegion =
        step.getHistoryRegion(hPoint);
    odb_HistoryOutputRepository& hoCon =
        histRegion.historyOutputs();
    odb_HistoryOutput& histOutU2 = hoCon["U2"];
    odb_SequenceSequenceFloat data = histOutU2.data();
    int numHDat = data.size();
    for (int i=0; i<numHDat; i++) {
        odb_SequenceFloat pair = data[i];
        cout << pair.constGet(0) << " "
        << pair.constGet(1) << endl;
    }
The output in this example is a sequence of tuples containing the frame time and the displacement value. The example uses nodal history data output. If the analysis requested history output from an element, the output database would contain one HistoryRegion object and one HistoryPoint object for each integration point.