Starting Tosca Structure.report in Tosca Structure.gui | ||
| ||
Once the generation of postprocessing files is finished, press View Report to open eventually generated VTFX files in Tosca Structure.view.
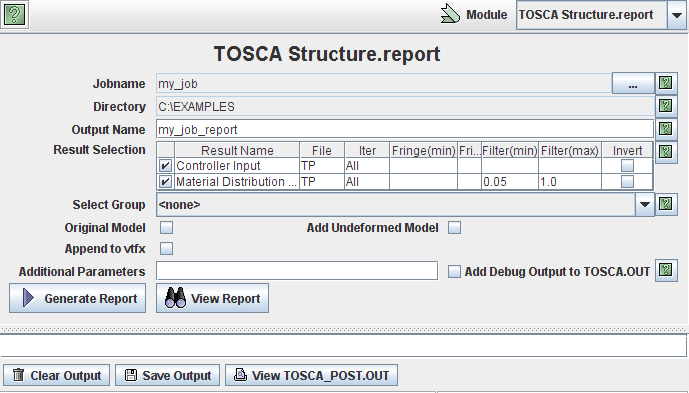
When selecting your parameter file, all optimization results available for this job appear in the result selection table. Per default, all results will be added to the report and can be visualized as 3D animation sequences. To decrease the report file size, several results can be excluded from the report generation.
Tosca Structure.report: Result Names |
||
|---|---|---|
Result Name |
File |
Generated visualization sequence |
Controller Input |
TP |
Controller Input from topology optimization shown as fringe plot on corresponding case |
Material Distribution (normalized) |
TP |
Relative material distribution from topology optimization shown as fringe plot on corresponding case |
Optimization Displacements |
SHAPE |
Shape optimization displacements (i.e. deformed model) shown on all cases with scalar results as fringe plots |
Controller Input |
SHAPE |
Controller input values from shape optimization shown as fringe plot on corresponding case |
Opt. Displacement Values |
SHAPE |
Optimization displacement values from shape optimization shown as fringe plot on corresponding case |
Optimization Displacements |
BEAD |
Bead optimization displacements (i.e. deformed model) shown on all cases with scalar results as fringe plots |
Controller Input |
BEAD |
Controller input values from bead optimization shown as fringe plot on corresponding case |
Opt. Displacement Values |
BEAD |
Optimization displacement values from bead optimization shown as fringe plot on corresponding case |
Specific settings are available for some of the results to control coloring and filtering.
Tosca Structure.report: Result Selection Parameters |
||
|---|---|---|
ITER |
ALL | LAST |<nr> |
Iteration(s) added to report, a specific number can also be entered |
FILTER MIN (MAX) |
<value> |
Minimum and maximum value for filtering. Applies only for result = Material Distribution (normalized). No or both values have to be set. |
FRINGE MIN (MAX) |
<value> |
Minimum and maximum value for fringe visualization. Applies for shape and bead controller input results. No or both values have to be set. |
ADD UNDEFORMED MODEL |
Adds undeformed model (in blue) to all displacement views in the vtfx file. |
|