To automatically convert the topology optimization result into report files, use Tosca Structure.report.
To view the result, you have 2 options:
-
If you want to have a quick view of the result, use Tosca Structure.view
and visualize the Material Distribution result type.
Filter(min) value defines the
limit for the soft elements (i.e. elements with a relative material value lower
than Filter(min)are not shown).
-
In Tosca Structure.report, select View Report to visualize the VTFX file with the optimization result.
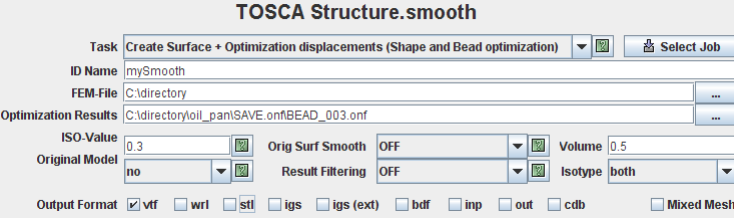
To further process the result, you have 2 options:
-
Define a smooth command int the parameter file and start a new optimization run.
-
Start the smooth run in the corresponding window in Tosca Structure.gui (VTFX output required)
:
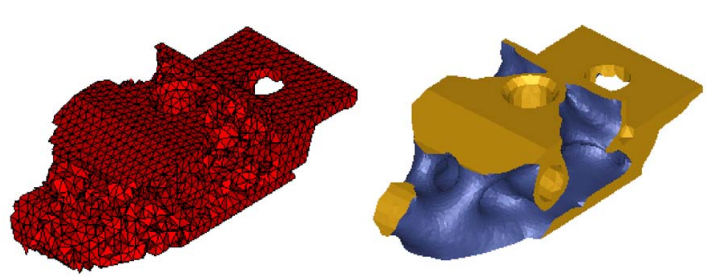
The result of the non smoothed final result (material distribution of last
iteration) and the smoothed looks as follows:
|