Re-executing the Model and Viewing Updated Results | ||
| ||
Click the
 button on the Design Gateway
toolbar.
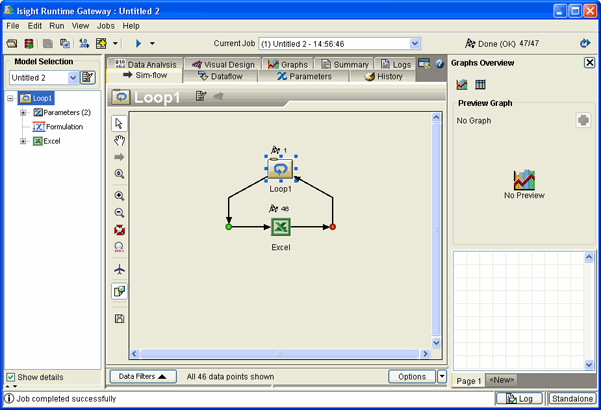
The Runtime Gateway appears, and Isight executes the model. The Runtime Gateway automatically loads the Excel workbook and changes the value of the cell that specifies the number of coils in the spring based on the Loop component you defined. You can minimize Excel to view the execution progress in the Runtime Gateway.
Once execution is complete, the message “Job completed successfully” appears in the lower-left corner of the interface, and
 icons appear above each component in the simulation
process flow, as shown below.
You can now view the results of the execution. In this example you will use the Summary tab and the History tab to view the results. These two tabs display information in different formats.
Note: The content of each tab changes depending on the component selected on the left side of the Runtime Gateway.
Verify that the Loop1 component is selected in the model explorer on the left side of the Runtime Gateway.
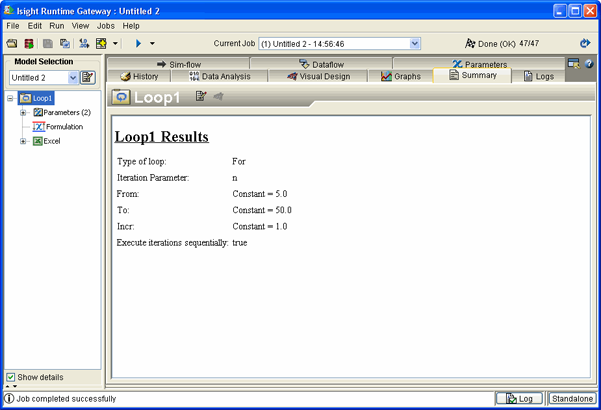
Click the Summary tab from the Runtime Gateway.
A summary of the execution for the Loop component appears. This summary does not include individual parameter values.

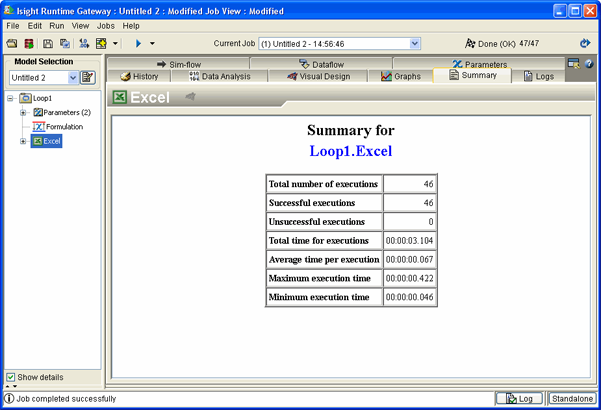
Click the Excel component in the model explorer on the left side of the Runtime Gateway.
The Summary information changes because the selected component has changed.

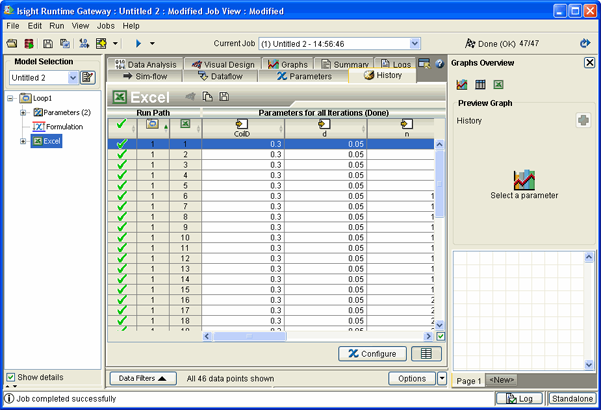
Click the History tab.
This tab shows parameter values for each run of the Excel component. The surge frequency decreases and the deflection and mass increase as the number of coils increases.

Select Close Window from the Runtime Gateway File menu to close the interface.
You are returned to the Design Gateway.
Select Close Current Model from the Design Gateway File menu to close the model.
The Save Model dialog box appears.
Save the model, if desired. It is not necessary to save the model to complete any of the other examples in this guide.
Important: Do not use the following characters in the model name: #, ?, &, %, !, \, $, {, }