Specialized Table Types | ||||
|
| |||
ANOVA (ANalysis Of VAriance) Tables
An ANOVA table shows the results of a statistical analysis of variance calculated on the selected response’s data set. ANOVA tables are available for the DOE and Taguchi Robust Design components. When the technique used produces a balanced factorial design (Fractional Factorial technique, Full Factorial technique, and some Orthogonal Array techniques), the total variance is broken down into contributions from each factor/interaction studied using the standard ANOVA technique. If the variance due to a factor is not statistically significant (not significantly larger the variance due to error) it is pooled with the error variance.
In all other cases, a functional ANOVA technique is performed by applying multiple linear regression to the data, fitting up to a quadratic regression model. The ANOVA table then reports the contributions to variance due to the model, the residual (error), and the total.
The following figure shows an example of a DOE ANOVA table:

![]()
Coefficients Tables
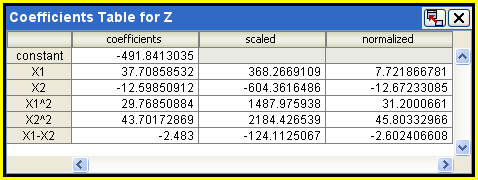
A coefficients table shows the coefficients calculated from regression analysis on the data set for a given response. Coefficients tables are available for DOE components and for the Six Sigma component if DOE analysis is used.
The following figure shows an example of a DOE coefficients table:

![]()
Correlation Coefficients Tables
A correlation coefficients table shows the linear correlation coefficients for the Monte Carlo random variables and responses. Correlation coefficients tables are available for Monte Carlo components and for the Six Sigma component if Monte Carlo Sampling is used.
The following figure shows an example of a Monte Carlo correlation coefficients table:

![]()
Probability Tables
A probability table shows the responses that have specified limits. Probability tables are available for Monte Carlo components and for the Six Sigma component if Monte Carlo Sampling is used.
The following figure shows an example of a Monte Carlo probability table:

![]()
Response Percentiles Tables
A response percentiles table shows response values at specified percentiles for the reliability responses. Response percentiles tables are available for Monte Carlo components and for the Six Sigma component if Monte Carlo Sampling is used.
The following figure shows an example of a Monte Carlo percentiles table:

![]()
Correlation Statistics Tables
A correlation statistics table shows the mean standard deviation, variance, skewness, kurtosis, range, minimum, and maximum. Correlation statistics tables are available for Monte Carlo components and for the Six Sigma component if Monte Carlo Sampling is used.
The following figure shows an example of a Monte Carlo correlation statistics table:

![]()
Reliability Tables
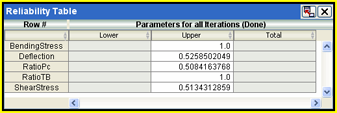
A reliability table displays the reliability analysis results, along with a summary of the defining characteristics of the reliability constraints. Reliability tables are available only for Six Sigma components that use a Reliability Analysis technique. The table shows:
-
the reliability constraint parameter name,
-
the value of the constraint parameter at the point being analyzed (the mean value of the constraint parameter),
-
the bound type (lower bound or upper bound),
-
the value of the bound (constraint value),
-
the reliability index, and
-
the actual reliability calculated during the reliability analysis.
If any reliability constraint has a lower and upper bound defined, the combined reliability is also calculated and reported in both the results file and in this table.
The following figure shows an example of a Six Sigma reliability table:

![]()
Six Sigma Tables
A Six Sigma table displays the Six Sigma plan results obtained for responses and random variables for which a lower and/or upper bound is defined. Six Sigma tables are available only for Six Sigma components.
For each parameter, the table shows:
-
sigma level,
-
probability of success,
-
probability of failure, and
-
number of defects per million.
If both lower and upper bounds exist, the results are reported separately for lower, upper, and combined totals (effects from both lower and upper bounds combined). The table is available only after execution.
The following figure shows an example of a Six Sigma table:

![]()
Taguchi Robust Design Experiment Data Tables
A Taguchi Robust Design experiment data table shows the values of the factors and responses for each experiment executed in the Taguchi nested arrays. Experiment data tables are available only for the Taguchi Robust Design component. The experiment number is given as <signal>,<control>,<noise>.
The following figure shows an example of a Taguchi Robust Design experiment data table:

![]()
Taguchi Robust Design Data Tables
A Taguchi Robust Design data table shows raw experiment data for a specified response for each control experiment. Taguchi Robust Design data tables are available only for Taguchi Robust Design components. The control experiments are shown in “coded” form. Separate columns of experimental data are presented for each signal-noise combination for each control experiment.
The following figure shows an example of a Taguchi Robust Design data table:

![]()
Taguchi Robust Design Response Summary Tables
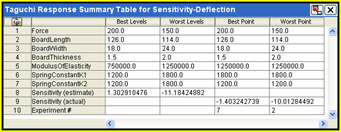
A Taguchi Robust Design response summary table shows the estimated best/worst factor levels and Taguchi metric value for the selected response/metric combination. Taguchi Robust Design response summary tables are available only for the Taguchi Robust Design component.
Metric selections include:
-
S/N ratio,
-
sensitivity (nominal-is-best responses only),
-
loss,
-
mean, or variance for static systems,
-
S/N ratio or sensitivity for dynamic systems, and
-
S/N ratio, beta 1, beta 2, or beta 3 for dynamic-standardized systems.
Taguchi Robust Design response summary tables display the estimated Taguchi metric value if the best/worst factor levels were not a control experiment point and display that actual value if confirmation runs were specified as part of the Taguchi Robust Design component plan setup and executed with the experiment points. The tables also include the best and worst point included in the control matrix. The relative benefit/loss, compared to the baseline design, is displayed if the baseline design was included in the Taguchi Robust Design component plan setup and executed with the experiment points.
The following figure shows an example of a Taguchi Robust Design response summary table:

![]()
Taguchi Robust Design Results Tables
A Taguchi Robust Design results table shows the Taguchi metric results for each control run for the specified response. Taguchi Robust Design results tables are available only for Taguchi Robust Design components.
For static system types, the results include the S/N ratio, sensitivity (nominal-is-best responses only), loss, mean, and variance.
For dynamic system types, the results include the S/N ratio, sensitivity, slope, total sum of squares caused by linearity, sum of squares because of error, and the error variance.
For dynamic-standardized system types, the results include the S/N ratio, the three polynomial fit coefficients (beta 1, beta 2, and beta 3), the total sum of the squares, the sum of the squares caused by the proportional effect, the sum of the squares caused by the interaction effect, the sum of the squares caused by error, the error variance, and the noise error variance. If the baseline design was executed, results are also displayed for the baseline.
The following figure shows an example of a Taguchi Robust Design results table:
