About Robustness and Six Sigma Quality | ||||
|
| |||
The term “robustness” in the robust engineering design context is defined as the sensitivity of performance parameters to fluctuations in design parameters (inputs), particularly uncertain design parameters. This sensitivity is captured through performance variability estimation. Consequently, the fundamental underlying motive in robust design is to improve the quality of a product or process by not only striving to achieve performance targets or goals, but also by minimizing performance variation. The question is then, how is robustness or quality measured, and what level of robustness is acceptable and/or desirable?
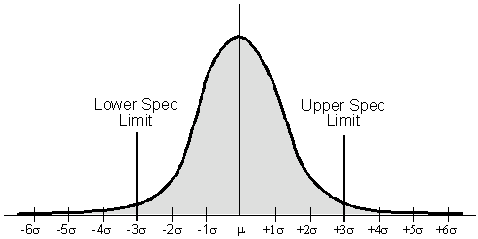
The term “sigma” refers to standard deviation, . Standard deviation or variance, , is a measure of dispersion of a set of data around the mean value of this data. This property can be used both to describe the known variability of factors that influence a system (product or process), and as a measure of performance variability and, therefore, robustness or quality. Assuming performance variation is normally distributed, this variation can be characterized as a number of standard deviations from the mean performance, as shown in the following figure. The areas under the normal distribution in the figure associated with each -level relate directly to the probability of performance falling in that particular range (for example, is equivalent to a probability of 0.683).
These probabilities are displayed in the following table as percent variation and number of defective parts per million parts.
Robustness or quality can be measured using any of the variability metrics in the following table, “sigma level,” percent variation or probability (percent variation / 100), or number of defects per million parts—by comparing the associated performance specification limits and the measured performance variation.
Sigma Level |
Percent Variation |
Defects per million (short term) |
Defects per million (long term) |
68.26 |
317,400 |
697,700 |
|
95.46 |
45,400 |
308,733 |
|
99.73 |
2,700 |
66,803 |
|
99.9937 |
63 |
6,200 |
|
99.999943 |
0.57 |
233 |
|
99.9999998 |
0.002 |
3.4 |
In the previous figure, the lower and upper specification limits that define the acceptable performance range are shown to coincide with from the mean. The design associated with this level of performance variance would be considered a “” design. Is this design of acceptable quality? Traditionally, if worth of performance variation was identified to lie within the set specification limits, as in the figure, this was viewed as acceptable variation; in this case, 99.73 of the variation is within specification limits, or the probability of meeting the requirements defined by these limits is 0.9973%. In engineering terms, this probability was deemed acceptable.
More recently, however, the quality level has been viewed as insufficient quality, initially from a manufacturing perspective, and then extended into an engineering design perspective. Motorola, in defining “six sigma quality” (Harry, 1997), translated the sigma quality level to the number of defective parts per million (ppm) parts being manufactured. In this case, as can be seen in the previous table, corresponds to 2700 ppm defective. This number was deemed unacceptable. Furthermore, Motorola and others observed that even at some observed variation level, mean performance could not be maintained over time. If a part is to be manufactured to some nominal specification, plus/minus some specification limits, the mean performance will change and, thus, the distribution will shift. A good example of this is tool wear. If a process is set up to manufacture a part to a nominal dimension of 10 in with a tolerance of in, even if the process meets this nominal dimension on average, the cutting tool will wear with time, and the average part dimension will shift, say to 10.05 in. This will cause the distribution of performance variation to shift, while the specification limits remain fixed; therefore, the area of the distribution outside one of the specification limits will increase.
This shift was observed by Motorola and others to be approximately and was used to define “long-term sigma quality” as opposed to “short-term sigma quality.” This explains the last column in the table. While the defects per million for short-term sigma quality correspond directly to the percent variation for a given sigma level associated with the standard normal distribution, the defects per million for long-term sigma quality correspond to a shift in the mean. In this case quality leads to 66,803 defects per million, which is certainly undesirable, and should be unacceptable. Consequently, Motorola defined a quality goal of ; therefore, “Six Sigma Quality” came to define the desired level of acceptable performance variation. With this quality goal, the level of defects per million, as shown in the table, is 0.002 for short-term sigma quality and 3.4 for long-term sigma quality—both acceptable quality levels.
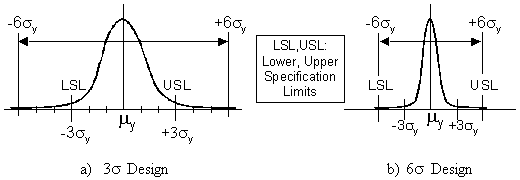
The focus on achieving six sigma quality is commonly referred to as design for six-sigma (DFSS) (Harry, 1998). In implementing DFSS within a robust design context, the “minimize performance variation” goal of robust design is qualified by striving to maintain six-sigma () performance variation within the defined acceptable limits, as illustrated in the following figure. In this figure the mean, , and lower specification limit (LSL) and upper specification limit (USL) on performance variation are held fixed. The following figure (part a) represents the design of the previois figure; worth of performance variation is within the defined specification limits. To achieve a design, one for which the probability that the performance will remain within the set limits is essentially 100%, the performance variation must be reduced (reduced ), as shown in the following figure (part b).
In real world design problems, often only one specification limit or design constraint is applied (lower or upper), or the nominal design is not centered between the specification limits. For this reason, the actual probability of failure, the area of the tail(s) outside the limits, is measured and an equivalent sigma level can be calculated. For example, if the lower limit is and the upper limit is at , this should not be called a , , or even a design. In the case of , each tail has 0.00135 probability, which is 0.0027 combined, and the area inside is then 0.9973. For the case of and , the tails are 0.00135 and 0.00003165 respectively for a combined probability of 0.00138 combined, giving an area inside of 0.9986. This translates to an equivalent sigma level of , not . This equivalent sigma level calculation allows fair comparison of alternate designs, with consistent probability of failure.
In summary, design robustness or quality can be measured through “sigma level,” probability of acceptable performance variation, or defects per million parts, both of which can be related to each other through the standard normal distribution. The recently defined goal for acceptable quality level is . To implement methods for calculating “sigma level quality” and improving the quality level of a design, the capability to estimate performance variability, given the presence of uncertainty in the problem formulation or input parameters, is required.