The cyclic stress-strain curve | ||
| ||
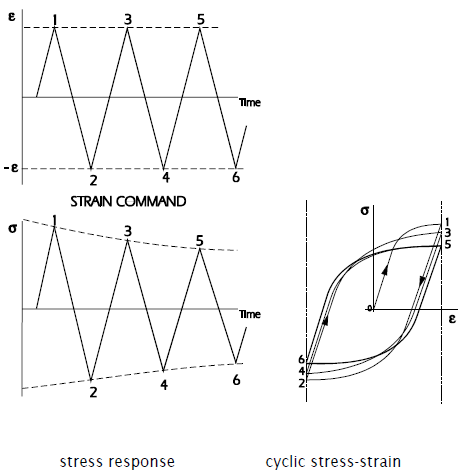
When a smooth test specimen is cycled between fixed strain limits, the stress response may show that the material is softening, producing lower stresses for each strain application. After a number of cycles the cyclic stress-strain curve stabilises, producing a stable hysteresis loop. (Figure 3.4)
For other materials the stress response may show that the material is hardening.
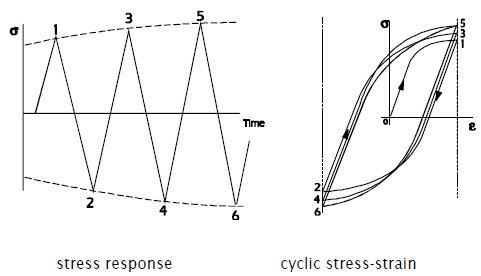
Cyclic hardening and softening were first reported by Bauschinger in 1886, and quoted by Unwin later in the same year.
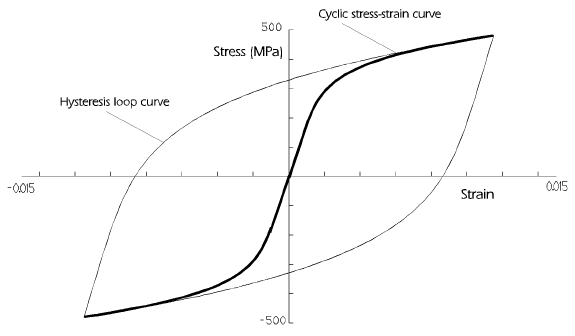
In Chapter 2 it was shown that the first strain excursion (of a cyclically stabilised material) follows the cyclic stress strain curve, and that subsequent strain excursions follow the hysteresis stress-strain curve.
Other strain amplitudes will produce stable hysteresis loops of different sizes, but all the loops will have their tips on the cyclic stress strain curve.
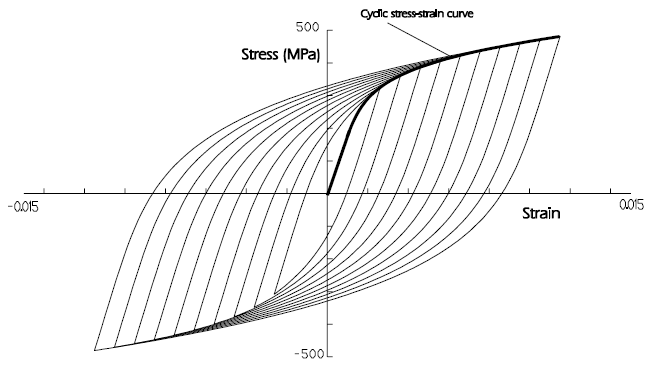
Figure 3.8 compares the monotonic tensile stress-strain curves produced in a tensile test, and stable cyclic stress strain curves for three typical materials.
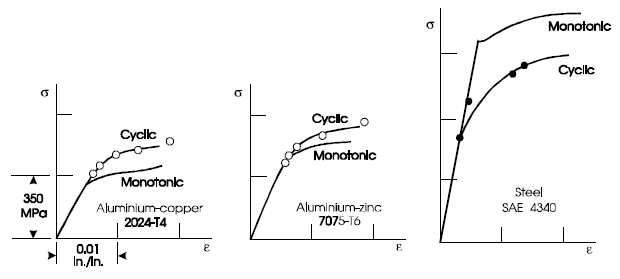
The material UTS and 0.2% proof stress σy can be used to predict whether a steel will cyclically harden or soften.
if the material will harden
and if the material will soften
In smooth specimen testing a specimen is cycled between fixed strain limits until the material stabilises. Cyclic stability is indicated by the force required to achieve the specified strain. The stress at the loop tips can be calculated from the applied load and the specimen diameter under load. Specimen diameter may be measured, or may be calculated using the axial strain and Poisson’s ratio. Other specimens are tested at different strain amplitudes. The set of stress-strain co-ordinates for the loop tips may be plotted. They will lie on the cyclic stress-strain curve.
Similar but not identical results can be obtained from an incremental step test, which uses one specimen.
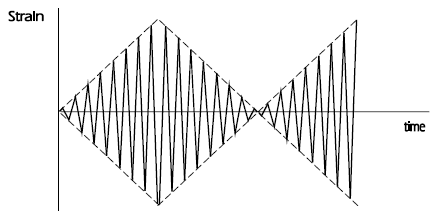
The specimen is subjected to a series of increasing and decreasing strain amplitudes. Once the material has stabilised, the stresses for each strain amplitude can be plotted to show the cyclic stress-strain curve.
The data from both types of test can be analysed to determine the material properties , and .
The equation for the cyclic stress-strain curve is
Taking the plastic component of strain,
Re-arranging this equation gives
Taking logs of both sides of this equation
which is the equation for a straight line on log-log axes.
The data points are plotted on axes of vs . (Figure 3.10)
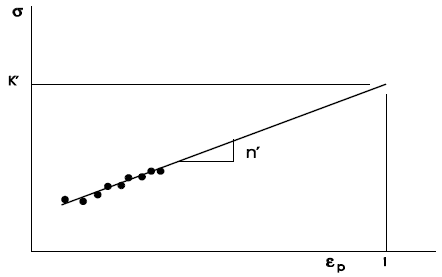
A least-squares regression analysis may be used to calculate the best-fit straight line through the data.
The slope gives the value of .
For an extrapolated strain of , in the equation
if then and so