Introduction | ||
| ||
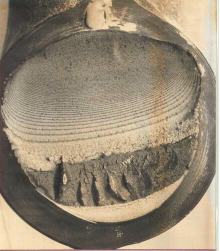
Fatigue cracks are caused by the repeated application of loads which individually would be too small to cause failure. Fatigue cracks usually initiate from the surface of a component (Figure 1.1). This is crack initiation. The crack may then propagate in a direction perpendicular to the direct stress. This is crack propagation. Finally the component may fracture

Modern fatigue theories provide separate analyses for each phase. Crack initiation theories are based on the assumption that fatigue cracks are initiated by the local strains and stresses on the surface of a component. Crack propagation theories relate crack growth to the stresses in the component. Final fracture is analysed using fracture mechanics. Earlier theories treated the whole of the fatigue life as a single entity, and related fatigue life to the calculated engineering stresses in the component. Much current research is attempting to describe the whole fatigue process by the study of crack propagation from very small initial defects.
Figure 1.2 shows a fatigue fracture from a shaft which was tested in bending. Crack initiation has occurred from the surface (at the top of the picture). The progress of the crack is shown by the bands - called striations, or beach marks - which occupy most of the fracture face, with a small area of brittle fracture at the bottom of the picture.

An early example of testing to determine the fatigue strength of a component was reported by W.A.J. Albert in 1838. He investigated the fatigue failure of chains used to haul trucks in mine shafts (Ref 1.1). Examples of the chains were tested using a purpose-built test rig (Figure 1.2). The weight was raised and lowered, applying repeated loads to the links of the chain.

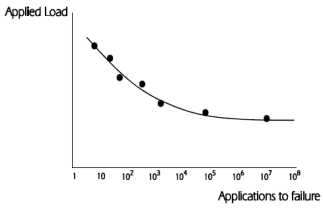
If a new chain is used for each test, and each chain is tested using a different load, the relationship between the magnitude of the applied load and the number of applications to cause fracture of the chain, can be plotted (Figure 1.4). The horizontal axis shows the number of load applications required to cause failure. This is the life of the chain, and is referred to as the endurance. It is always plotted on a log10 axis. The vertical axis shows the magnitude of the applied load.
