Constant amplitude tests | ||
| ||
The simplest fatigue tests use constant amplitude sinusoidal loading and it has been estimated that more than 99% of all fatigue tests use constant amplitude loading. This is unfortunate, because the results of constant amplitude tests can be very misleading.
Constant amplitude tests may not identify the failure locations. Figure 13.1 shows the failure locations obtained from service load tests on a fabricated panel from an aircraft.
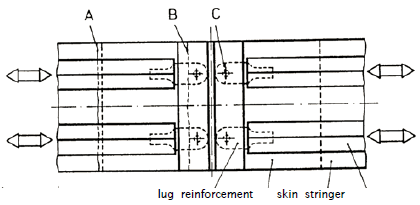
The service load tests showed that there were three potential failure locations (A, B and C). Constant amplitude tests on the same panel reproduced only failure location A. In general, constant amplitude tests cannot be relied on to identify the fatigue-critical areas which require re-design or which require regular inspection in service. Constant amplitude tests may also identify different failure locations at different test amplitudes, as shown by the tests on splined shafts (Figure 13.2).

Constant amplitude tests may not identify the best material or manufacturing process.
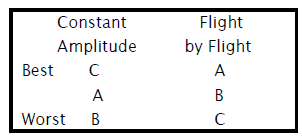
Tests on riveted lap joints in an aluminium alloy sheet material ranked three different rivet materials (A, B, and C) using constant amplitude and flight-by-flight tests. The results are shown in Table 1.
Tests to compare different materials can be similarly misleading. Figure 13.3 shows S-N curves for two different materials. If a large amplitude signal is used, material B will be shown to be superior to material A. If a small amplitude signal is used, material A will be shown to be superior. In addition, in this example the small amplitude signal is below the constant amplitude endurance limit, which may also give misleading results. Re-scaling real service loading signals to accelerate a test may give similarly misleading comparisons.

Constant amplitude tests may give misleading fatigue lives.
Few components experience constant amplitude loading in service - real service loading contains many different amplitudes and different mean stresses. Cumulative damage rules and mean stress correction methods must be used to estimate service lives from constant amplitude tests, and these introduce errors and uncertainty. Some of the uncertainties in using cumulative damage rules (Miner’s rule) are described in this chapter.
Constant amplitude tests increase the scatter in test results.
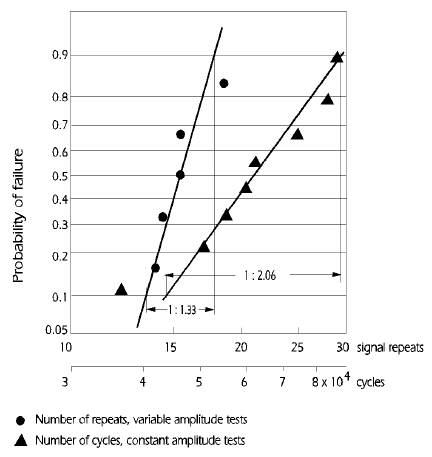
Figure 13.4 compares the scatter in the fatigue life obtained from tests on nominally identical components tested under constant amplitude loading and under representative service loading. The horizontal axis covers a factor three on life.
The standard deviation of the test lives under constant amplitude loading is much greater. This means that whilst a single constant amplitude test may be quicker and cheaper, it will be necessary to test many more specimens to obtain a valid estimate of the mean fatigue life. In addition, safety factorsestimated from the scatter on constant amplitude test lives might be excessively conservative.